Solo Ads Benchmarks 2026: Real Numbers From Documented Orders
Every solo ads statistic circulating online — "30–50% is a healthy opt-in", "vendors charge $0.40–$1.00" — traces back to no dataset at all. The numbers below are different: they come from written buyer reviews and delivery reports of my own orders, screenshots included, with the methodology and the limitations stated. Cite them, check them, or beat them with your own.
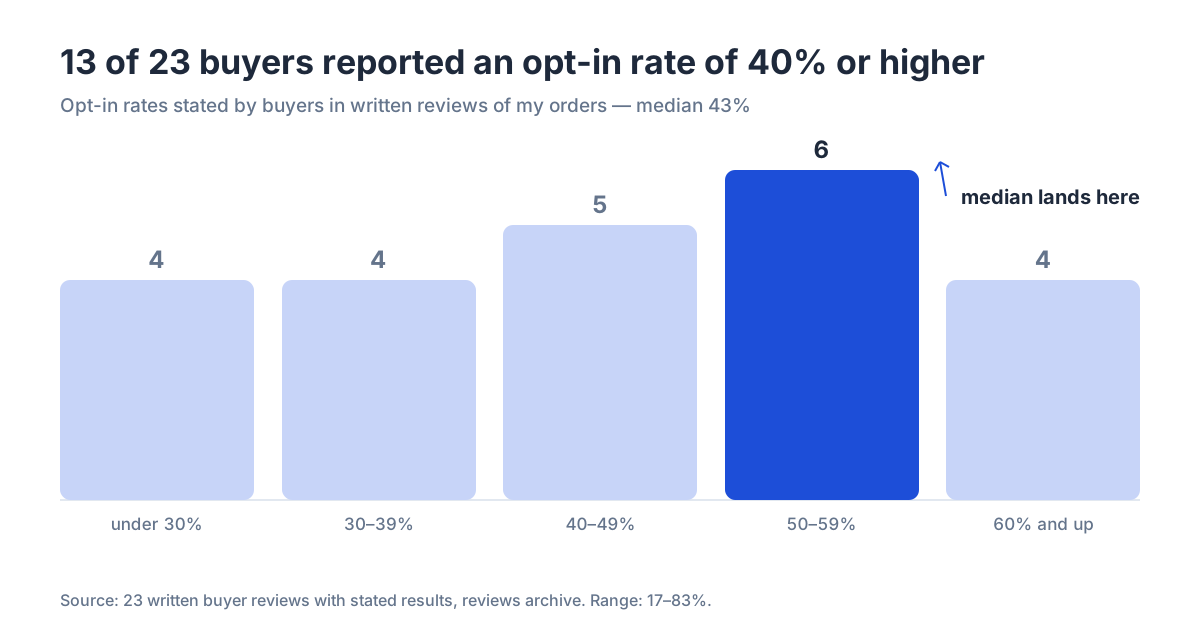
Median buyer-reported opt-in: 43% (range 17–83%, n=23). Median over-delivery: +38%, with 15 of 15 documented orders delivering above the promised amount (n=15). Observed market price for real clicks: $0.23–$0.95. Last updated August 2026.
Methodology below →Methodology and limitations
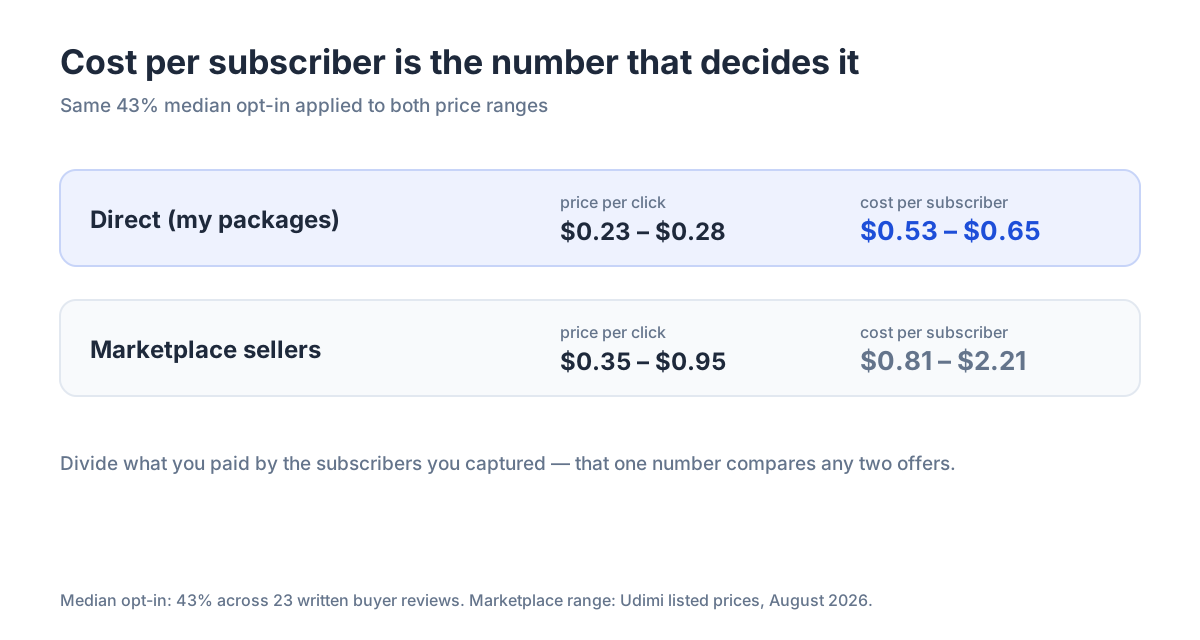
Sources: 23 written buyer reviews of my orders that state a measured opt-in result, and 15 delivery-report screenshots with visible ordered/delivered totals, all from the public reviews archive (400+ screenshots, collected 2012–2026; stated results concentrated in recent years). Pricing reflects my published packages ($0.23–0.28 per click) and Udimi's listed seller range ($0.35–0.95, August 2026).
Limitations, honestly: opt-in rates are self-reported by buyers; n is small; all delivery data comes from one seller (me), so over-delivery figures describe documented sellers, not the market's bottom shelf. That still makes this — as far as I can find — the only solo ads benchmarks page built on first-party numbers at all.
Opt-in rate benchmarks
| Percentile | Opt-in rate | Reading |
|---|---|---|
| Low end of range | 17% | Weak capture page — fix the page before blaming traffic |
| Median | 43% | A normal, healthy campaign |
| 13 of 23 buyers | 40%+ | The realistic target with a clean opt-in page |
| High end of range | 83% | Excellent page + matched offer |
The 17–83% spread on comparable traffic is the most useful fact on this page: the landing page, not the click, decides most of the outcome.
Over-delivery benchmarks
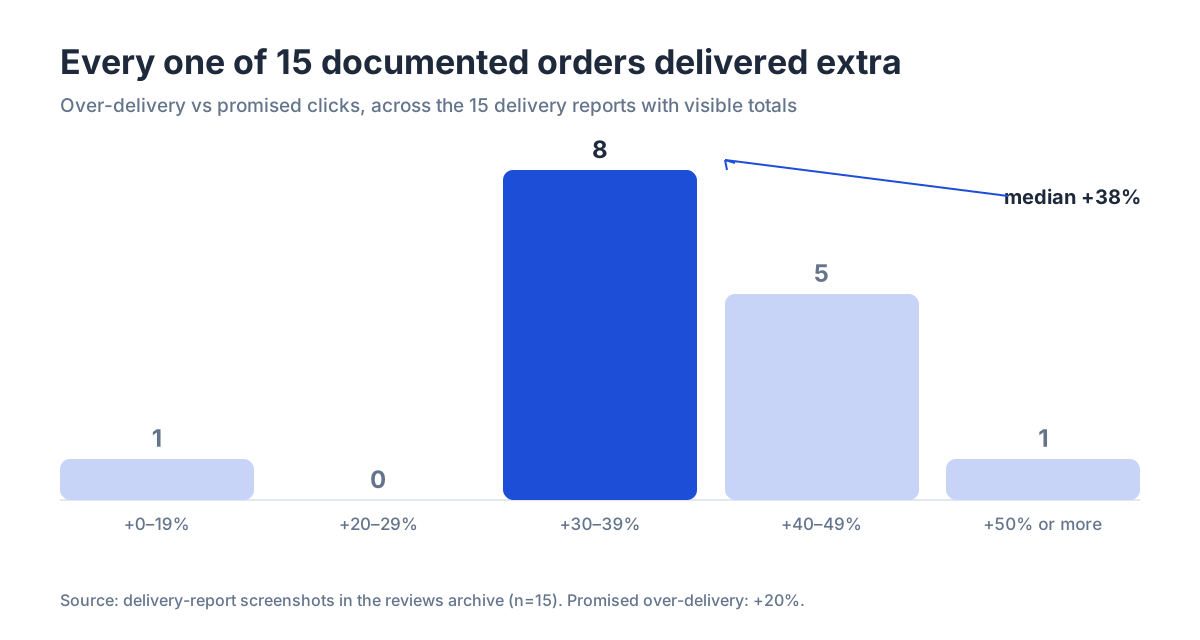
Across the 15 reports with visible totals: every order delivered above the promised volume; the promised bonus was +20% and the median actual came to +38%, with a +2% to +50% range. Nobody else measures this metric publicly — treat any seller's delivery report as the place to check it.
Pricing benchmarks and effective cost
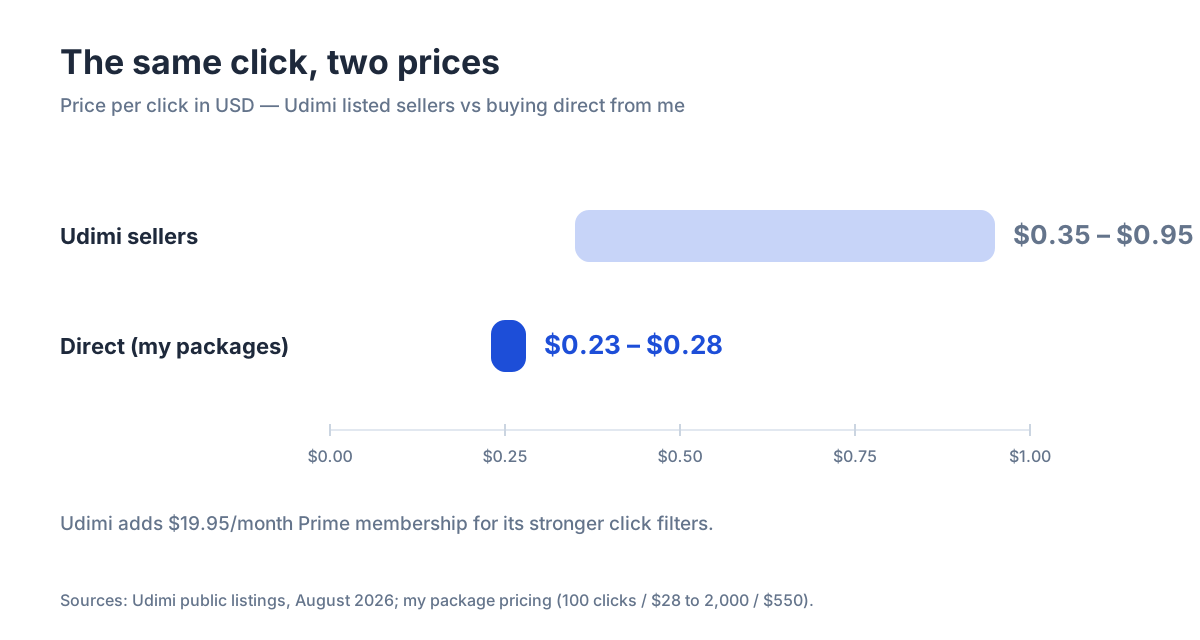
Headline prices understate the differences. A $0.28 click that over-delivers 38% costs an effective $0.20; a $0.60 marketplace click plus a $19.95/month Prime membership costs more than its sticker. Divide what you paid by clicks received, then by subscribers gained:
The proof layer: documented campaigns
Benchmarks summarize; cases verify. Three documented campaigns — 125 clicks → 97 subscribers → $37.23; 200 → 110 → 4 sales; $38 → $97/month recurring — are walked through, screenshots and all, in the case study article.
How to read your own numbers against these
| Your result | Likely cause | Fix first |
|---|---|---|
| Opt-in under 25% | Capture page, not traffic | One offer, one field, no menu — retest 100 clicks |
| Opt-in 40%+, no sales | Sequence or offer | 5–7 email follow-up, offer with a back-end |
| Delivered ≈ ordered exactly | No over-delivery culture | Compare sellers — documented ones routinely exceed |
| Clicks but near-zero uniques | Traffic quality | Own tracker on every order; evidence, then escalate |
Definitions
Opt-in rate — subscribers gained ÷ unique clicks received. Over-delivery — clicks delivered beyond the ordered amount, as a percentage of the order. Tier-1 traffic — clicks from the US, UK, Canada, Australia, New Zealand. Cost per subscriber — total paid ÷ subscribers gained; the number that compares any two traffic sources honestly.
This page is updated as new documented reports enter the archive. Last update: August 2026.
Frequently asked questions
What is a good opt-in rate for solo ads?
The documented median is 43%, and 13 of 23 buyers with stated results reported 40% or higher. Below 25%, fix the capture page before blaming the traffic — the documented range on comparable clicks runs 17–83%.
What do solo ads cost in 2026?
Documented real-click pricing runs $0.23–$0.95: my direct packages at $0.23–0.28, Udimi's listed sellers at $0.35–0.95 plus an optional $19.95/month Prime membership.
What is over-delivery in solo ads?
Clicks delivered beyond the ordered amount. Across 15 documented reports, every order over-delivered — median +38% against a promised +20%. It's the metric no one else publishes.
Where do these numbers come from?
Written buyer reviews (n=23 with stated results) and delivery-report screenshots (n=15) from the public reviews archive, plus published package and marketplace prices. Methodology and limitations are stated above — the numbers are checkable.